
Gold declined to near the lowest level in four weeks as the U.S. dollar and bond yields rebounded ahead of a key Federal Reserve meeting. Gold steadied near the lowest level in four weeks as investors awaited the conclusion of the Federal Reserve’s two-day meeting for clues on monetary policy.
Posts by admin
Gold Imports by China Hit Fresh Record in April

The country’s gold imports surged to hit 111 tonnes during the month. This is the highest level of import since January 2020. The imports during the month were up by 73 tonnes from the prior month and by 106 tonnes from the same month a year before. The higher imports by the country were mainly on account of escalated gold demand and lower local gold supply.
Gold drops to near four-week low as key FED meeting in focus
Gold declined to near the lowest level in four weeks as the U.S. dollar and bond yields rebounded ahead of a key Federal Reserve meeting. Bullion’s retreat from the highest level since January earlier this month came as investors weigh inflation pressures and the Fed’s monetary policy path. Expectations are that the central bank won’t signal scaling back bond purchases until August or September, even if it delivers projections for interest-rate liftoff in 2023.
Gold hits weekly lows near $1860 amid USD strength, focus shifts to FOMC
Gold price is bearing the brunt of the persisting upbeat tone seen around the US dollar, as investors flock to the safe-haven ahead of the FOMC decision this week. Although…
Gold falls amid prospects FED could be less dovish

Gold extended a decline as investors await this week’s Federal Reserve meeting for clues on the future path of monetary policy. Fed officials could project interest-rate liftoff in 2023 amid faster economic growth and inflation, but they won’t signal scaling back bond purchases until August or September
QE Tapering and Impact on Gold

The Federal Reserve is likely to announce in August or September a strategy for reducing its massive bond-buying program, but won’t start cutting monthly purchases until early next year. This means FED will start Tapering the QE of $120 Billion gradually and reduce to $110 billion, then $100 billion, then $90 billion and so on
Gold edges higher after U.S. inflation data

Gold prices nudged up on Friday after data showed U.S. consumer prices increased more than expected last month but eased fears over the Federal Reserve tapering its monetary support. Data showed U.S. consumer prices increased further in May as continued economic recovery from the pandemic boosted domestic demand. Weekly jobless claims also dropped to their lowest level in nearly 15 months
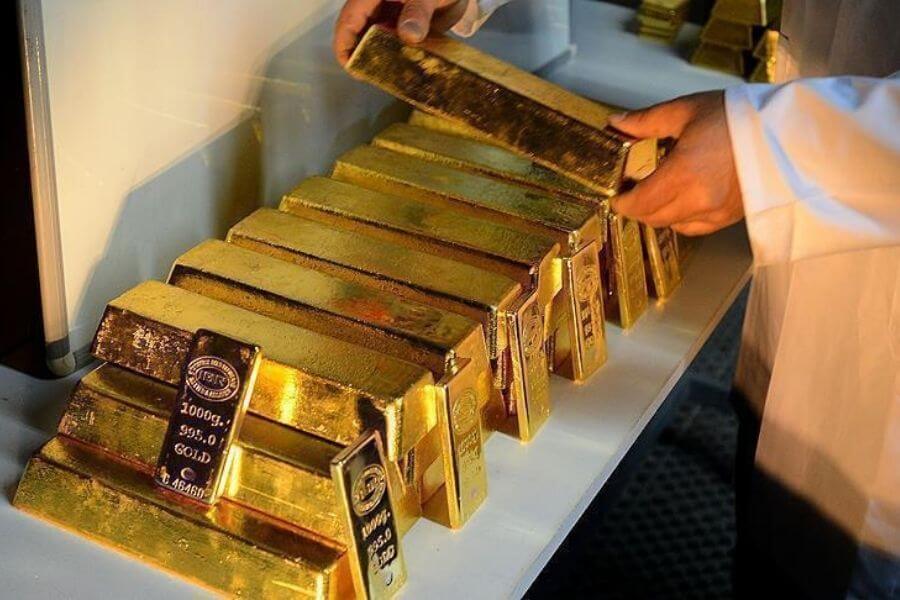
Central bank gold buying gathers steam

Central banks have been buying gold during the first four months of 2021. Over that period, we estimate that the official sector has added 150-200 tonnes of gold. A significant portion of this buying has come from the central banks of Hungary and Thailand, who added 63 tonnes in March and 43.5 tonnes in April, respectively.
Gold reclaims $1,900/oz mark as dollar, yields slip after U.S. data

Gold prices edged above $1900 per ounce level on Friday, supported by a pullback in the dollar and lower bond yields, after data showing a rise in U.S. inflation was viewed inadequate to alter the Federal Reserve’s easy monetary policy. The rise in U.S. inflation failed to spark a tapering sell-off. That saw bond yields edge lower helping gold to bounce back
Gold treads water as Investors await U.S. Inflation report

Gold steadied as investors awaited Thursday’s U.S. inflation report that may provide clues on the Federal Reserve’s monetary policy path. The 10-year Treasury yield extended declines after falling below 1.5% for the first time in a month on Wednesday, helped by a strong auction, while the rate on the U.S. long bond dropped to a level unseen since early March. This suggests that the Fed’s assurances that elevated inflation was probably temporary is gaining acceptance from investors.
Gold price chart posts bullish “Golden Cross” formation, will it rally?
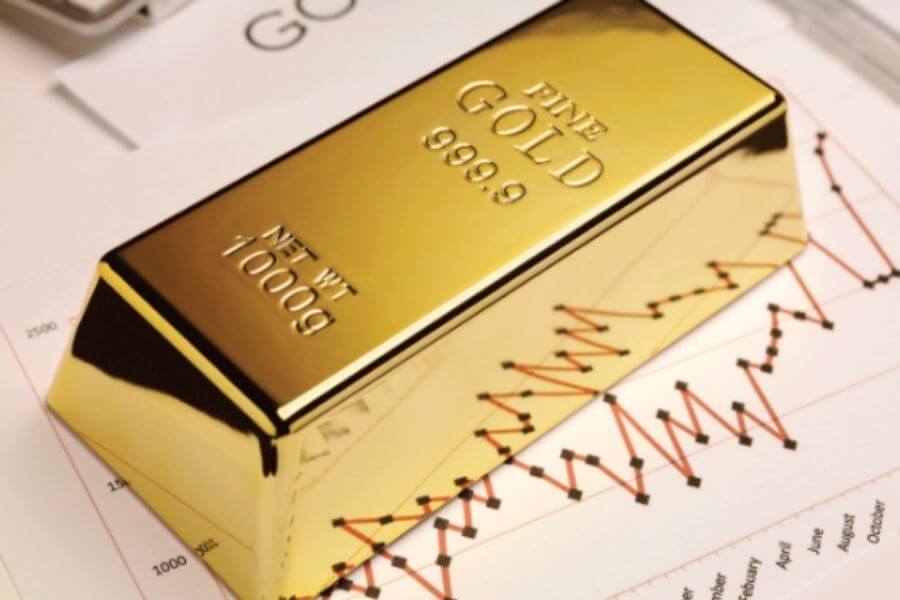
Gold prices may continue to rise after the precious metal posted a bullish moving average crossover on the daily chart early this week. In the case of the gold price chart, the 50-day simple moving average has overtaken the 200-day simple moving average around the $1828 price point and may equip gold with the bullish sentiment required to push higher
How much silver is needed for the solar panel industry?

According to the We Recycle Solar website, silver can use up to 6% of the total cost of building each unit of a solar panel and the average panel of approximately metres can use up to 20 grams of silver. As of 2018, the solar panel manufacturing industry used about 8% of the world’s annual physical silver supply.