Gold and Silver – Kya Lagta Hai
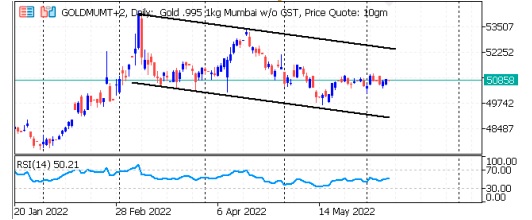
Short-term View (up to 1 week) -Rangebound–– Gold maintains the short-term bearish tone according to the daily chart, as indicators suggest a continued decrease in buying interest. The RSI maintains a negative slope below its midline, while the MACD shows that the bullish momentum is slowly fading
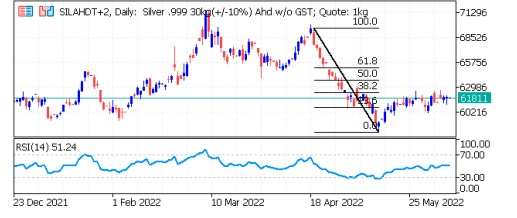
Long-term View (3-4months) -Positive – Any dips towards 50000 and 60000 should be used as buying opportunities for the target of 55000 and 70000 for Gold and Silver respectively
SPOT PRICES

SPOT Gold Daily Price Chart

SPOT Silver Daily Price Chart

Important News and Triggers
Precious metal gets support from revised GDP forecast
- International News – OECD forecasted that global GDP will come in at 3% this year, which is lower than the 4.5% projection in December. It said it opted to adjust
its growth forecast, as a result of the Russia/Ukraine war - Demand and Supply – – US mint sold 147,000 ounces of American Gold Eagles in varying denominations totaling 200,500 coins in May, a 67% increase from March
- Economic Data – – The end of year Fed Funds futures contract is now pricing in rates of 2.70%, which implies another 100-basis points of tightening over the next 2-
meetings. - Domestic News– India imported 101 tonnes of gold in May, compared to 13 tonnes a year earlier due to Akshaya Tritiya and Wedding Season
- International News – OECD forecasted that global GDP will come in at 3% this year, which is lower than the 4.5% projection in December. It said it opted to adjust
