Market participants are still dealing with uncertainty: uncertainty about the timing of future Federal Reserve monetary policy changes, uncertainty about the length and impact of the new Delta variant of Covid-19 on human lives and economic recovery, and uncertainty about the Taliban’s takeover of Afghanistan.
As a result, the US Dollar rose sharply, which could have led to a drop in gold prices. However, it dampened broader sentiment, causing capital flows to shift away from riskier assets and toward the safety of government bonds. Those anchored yields, giving the non-interest-bearing yellow metal a reprieve.
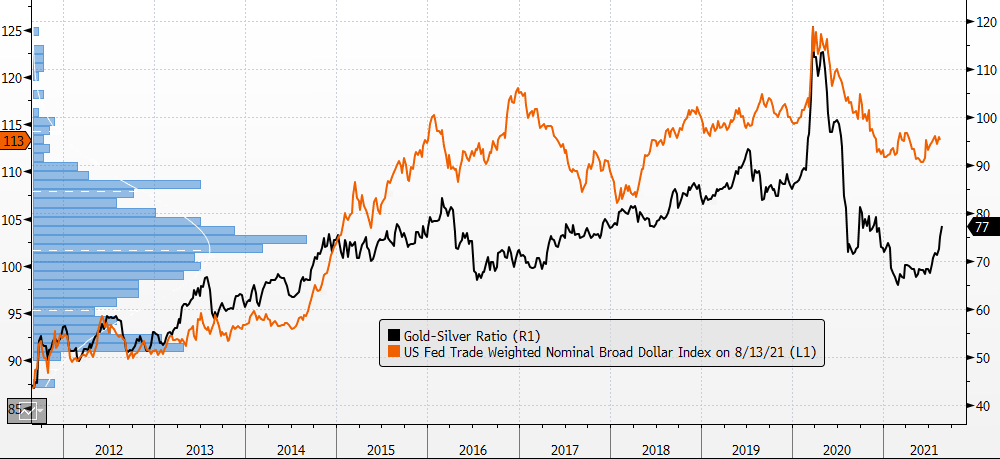
However, Gold is still standing strong in the range of Rs 46400 to Rs 48000 amid all these uncertainties, while silver prices seem to be vulnerable towards 58000. The spot gold-silver ratio currently stands at 77, an eight-month high, indicating that gold has outperformed silver.
Gold/Silver Ratio and Dollar Index

With all eyes on next week’s Jackson Hole conference, a barebones data docket appears unlikely to promote directional movement. The annual conclave is frequently used to reveal substantial shifts in Fed officials’ thinking, which lead to policy changes. For the time being, gold prices may remain linked to traditional ranges.
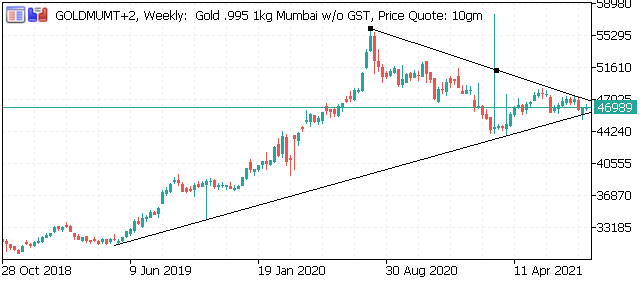
Gold seems to be trading in a symmetric triangle from last 2 years. Triangle has narrowed down now, with support at Rs 46400/10 gm and resistance at Rs48000/ 10 gm. Prices need to give a breakout or breakdown to next major view.
Spot Gold weekly Chart

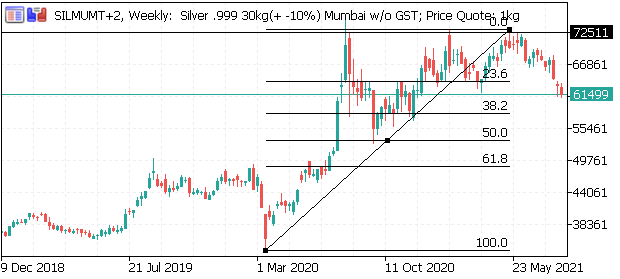
Silver has closed at strong support at Rs 61500/kg, if prices sustain below it, prices can fall towards Rs 58000 /Kg (38.2% Fibonacci retracement). While upside resistance (23.6% Fibonacci retracement) is Rs 64000/Kg, prices need to clear this resistance to rebound and head higher towards Rs 68000/Kg.
Spot Silver Weekly Chart

You may also like to read: Gold premiums in India fall sharply as COVID hits retail demand
