Gold and Silver – Kya Lagta Hai
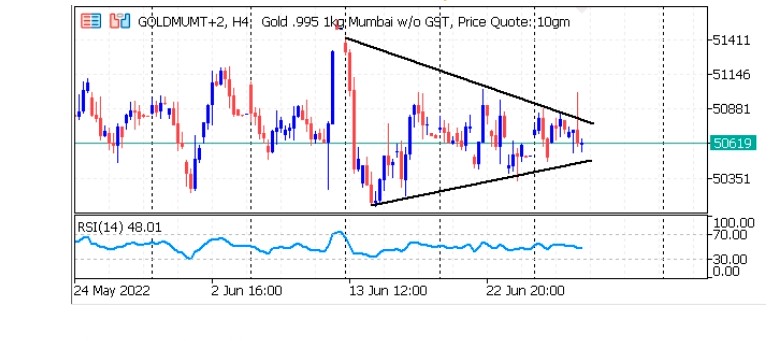
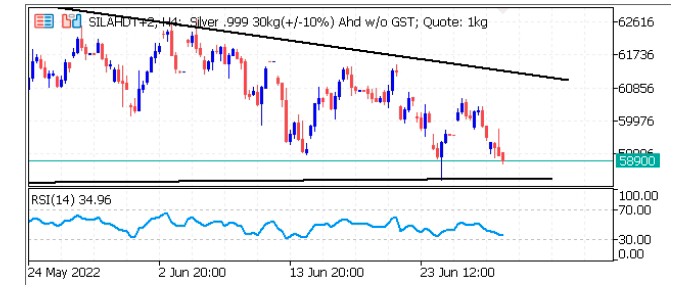
Short-term View (up to 1 week) – Rangebound– On an hourly scale, the gold and silver prices are auctioning in a Symmetrical Triangle that signals a volatility contraction followed by a breakout in the same.
Long-term View (3-4months) – Positive – Any dips towards 50000 and 60000 should be used as buying opportunities for the target of 55000 and 70000 for Gold and Silver respectively
SPOT PRICES

SPOT Gold Hourly Price Chart

SPOT Silver Hourly Price Chart

Important News and Triggers
- International News – Bullion prices seesaw between small gains and losses yesterday as investors assessed weaker-than-expected US GDP data and hawkish comments from Fed Chairman.
- Demand and Supply – New York Fed President John Williams and San Francisco’s Mary Daly both acknowledged on Tuesday they had to cool the hottest inflation in 40 years, but insisted that a soft landing was still possible. The Fed raised its benchmark rate this month by 75 basis points.
- Economic Data– Data showed that the annualized US GDP contracted by 1.6% in the first quarter. The figures fueled recession fears in the US as the Fed carries out its contractive monetary policy and inflation remains at a four-decade high.
- Domestic News– Gold ETFs in India have seen small positive inflows so far in June, likely driven by continued market volatility and a depreciating rupee. The RBI added 3.7t to its gold reserves in May, the highest monthly addition since December 2021 (also 3.7t). This took total gold reserves to 765.1t (7.5% of total reserves).
