Gold and Silver – Kya Lagta Hai
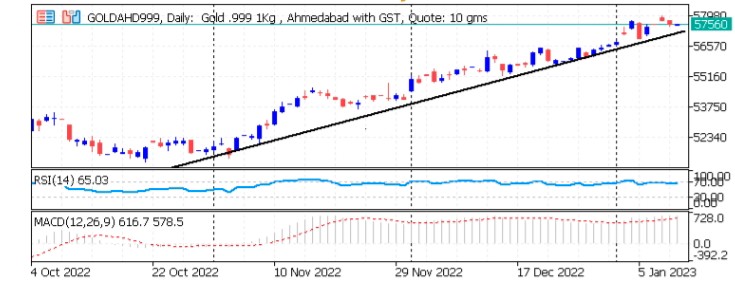
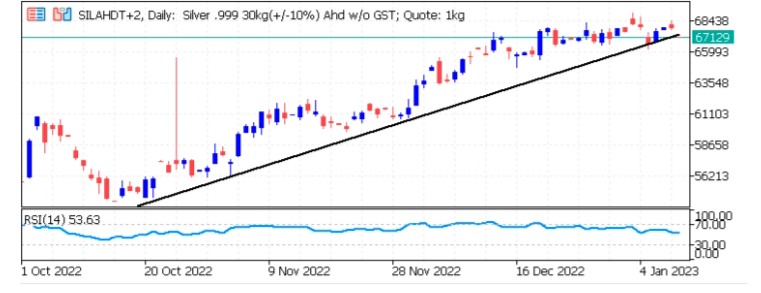
Short-term View (up to 1 week) – Negative– Gold and Silver prices are continuously getting support on uptrend line. As prices have runup too fast, some profit-booking is expected
Long-term View (3-4months) – Positive – – Gold has made Inverse Head and Shoulder pattern on daily charts. Neckline resistance is $1820. If prices sustain above it, target would be $2020.
SPOT PRICES

SPOT Gold Hourly Price Chart

SPOT Silver Hourly Price Chart

Important News and Triggers
Gold eyes further upside before US Inflation data
- International News – Gold price climbed to $1880 at the start of the week, thereby posting an eight-month high. Bullish chart pattern, World Bank economic forecasts add strength to the Gold price even if US Dollar probes buyers. World Bank stated that it expects the global economy to grow by 1.7% in 2023, down sharply from 3% in June’s forecast.
- Economic data – The market expects the inflation rate to have fallen from 7.1% to 6.5%. US inflation data could lend further tailwind to the gold price given that the slowing of inflation that has been observed since the summer is likely to have continued last month.

1 Comment. Leave new
Your point of view caught my eye and was very interesting. Thanks. I have a question for you.