By Dr. Renisha Chainani, Head- Research, Augmont – Gold for all
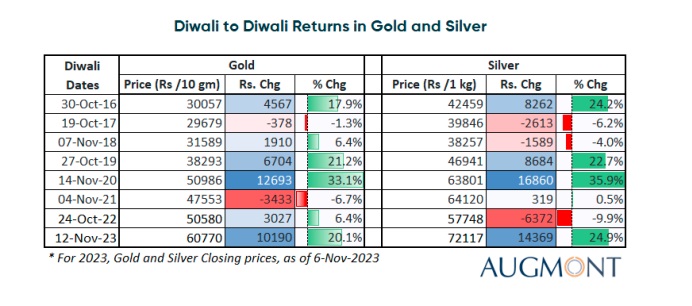
It is considered very auspicious to buy gold during the Dhanteras- Diwali festive season in India. Due to its high liquidity, ease of storage, and strong inflation protection, gold is regarded as a preferred investment option. Since Diwali last year, Gold prices have risen over 20% from the level of ₹50000/ 10 gm in the Indian market to almost ₹60000 now. Silver has outperformed gold rising around 25% since last Diwali.
Gold has made fresh record highs in Euros, UK Pounds, Japanese Yen, Chinese Yuan and most other currencies in the last 3 months. In dollar terms, it’s 4% away, while in rupee terms, it’s just 2% away. Gold first crossed the level of $2000 during COVID-19 when the first wave of catastrophe was hit in March 2020. Then $2000 gold came on Russia invading Ukraine in early 2022, followed by $2000 gold during March 2023’s mini banking crisis. And we are again above $2000 on the Israel-Hamas Conflict. It seems, gold bulls would appear to love misery and death. Or we can say, that when there is “Fear” sentiment in the market, investors become “Greedy” to buy Gold.
The first things that immediately come to mind when you think of safe havens as a store of value during economic and financial instability are US dollars, Swiss francs, US Treasuries, and gold. But gold has stood out as the single name living up to its reputation in the current global crisis scenario, shining at a time when the US dollar and Treasuries have appeared anything but rock-solid.
Undoubtedly, the turmoil in the Middle East has created geopolitical uncertainty, which in turn has fueled a safe-have demand for gold and raised prices from their seven-month lows. Nevertheless, other forces are also at play in the market that are keeping prices above $2000.
Those factors are growing US debt, rising deficits, falling money supply and the hawkish stance of the FED. A contributing factor in the breakdown of gold’s negative correlation with bond yields is the growing market concern over the fiscal outlook and the country’s ballooning debt, which now stands at over $33 trillion. The possibility of a debt spiral for the US economy is becoming more and more likely as increasing interest rates translate into greater borrowing costs, which prompts the demand for additional capital.
The rapid increase in interest rates is one of the reasons why markets are now focused on the United States’ mounting debt. The Federal Reserve’s 5.25–5.50% interest rate range indicates that the United States government is currently spending more on debt servicing than on national defence. In addition to its aggressive rate hikes, the Fed has shrunk its balance sheet, dramatically lowering the M2 money supply—the total quantity of money in circulation held by the general population. The Fed is perceived as having increased its balance sheet excessively due to growing deficits.
Asset values are gradually declining because there is less money in circulation. In order to meet your credit needs at higher levels, you now need additional assets. Given how easily things may go out of control, this is the last thing you want to happen. I believe this is the reason why investors are looking to gold: they perceive it as a trustworthy asset. Gold is the sole safe-haven investment option available if you’re not just interested in US government bonds. Due to the uncertainties surrounding the situation, I believe that gold will continue to perform well (even if global tensions subsidise) and maintain its upward trend until the US government can reduce its expenditure, which is unlikely to happen very soon.
Moreover, after the record 1137 tonnes of gold buying in 2022, Central banks have bought 800 tonnes in the first nine months of 2023, up 14% YoY, as per WGC. Central banks’ inclination towards gold is partly motivated by their goal to minimize reliance on the US dollar as a reserve currency following America’s use of the dollar as a weapon in its sanctions on Russia.
From a technical perspective, Gold has created a triple top pattern around $2080 (~ Rs 63000) in the last three years, so that is a very important resistance for prices to clear. A lot of positive news, follow-through buying and fear would be required for prices to surpass that level.
International Gold Monthly Chart
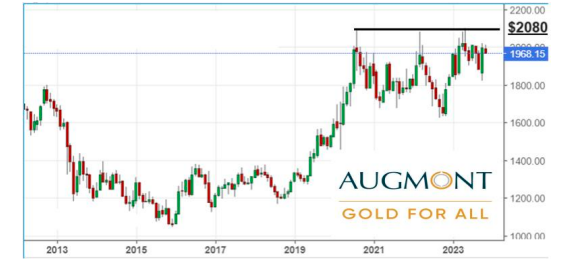
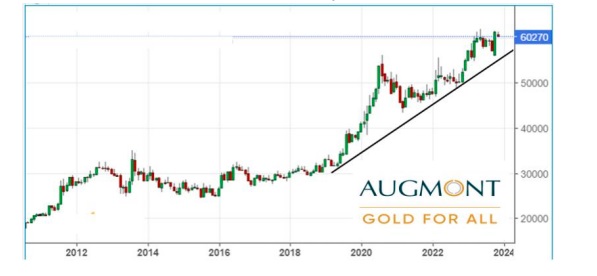
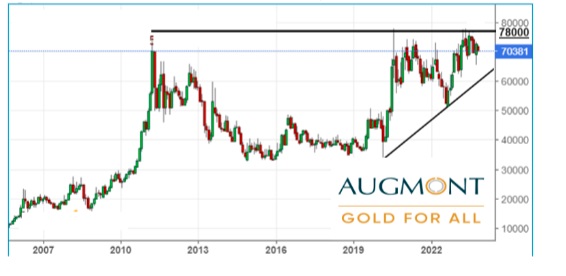
Once it does, though, the possibilities is that the bull run won’t end until $2250–$2300 (~Rs68000–Rs 69000). While on the downside, prices have formed a base around $1900 (Rs 58000), which would act as the floor of this bull run. Any dips towards Rs 59000- Rs 59500 should be used as a buying opportunity during this Diwali season.
Indian Gold Monthly Chart
Silver has very strong up-trendline support at $21 (~ Rs 66000), which is stretched from the year 2020. I don’t think, prices to trade below this level in the next few months. Any dip towards Rs 68000-69000 should be used as a buying opportunity this Diwali season.
International Silver Weekly Chart
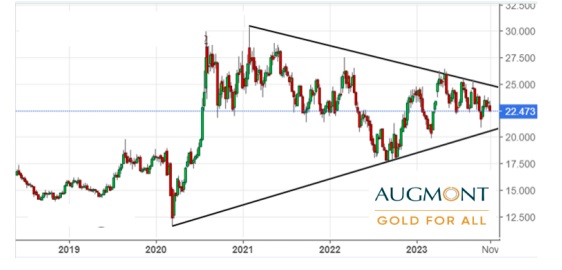
On the upper side, resistance is $24 (~ Rs 75000), if prices manage to clear and sustain above these levels, targets would be $26 (~Rs 80000), $28 (~Rs 85000) and $30 (~Rs 90000).
Indian Silver Monthly Chart
The best way to stay invested in gold is through Augmont Digital Gold and Augmont Digital Silver for better returns. Those who have missed the October 2023 rally, can still take advantage as there is a 15% upside in Gold and a 20-25% upside expected in Silver by next Diwali.
Disclaimer: This report contains the opinion of the author, which is not to be construed as investment advice. The author, Directors, and other employees of Augmont Enterprise Private Ltd. and its affiliates cannot be held responsible for the accuracy of the information presented herein or for the results of the positions taken based on the opinions expressed above. The above-mentioned opinions are based on information, which is believed to be accurate, and no assurance can be given for the accuracy of the information. The author, directors other employees and any affiliates of Augmont Enterprise Private Ltd cannot be held responsible for any losses in trading. In no event should the content of this research report be construed as an express or implied promise, guarantee or implication by or from Augmont Enterprise Private Ltd. that the reader or client will profit or the losses can or will be limited in any manner whatsoever. Past results are no indications of future performance. Information provided in this report is intended solely for informative purposes and is obtained from sources believed to be reliable. The information contained in this report is in no way guaranteed. No guarantee of any kind is implied or possible where projections of future conditions are attempted. We do not offer any sort of portfolio advisory, portfolio management or investment advisory services. The reports are only for information purposes and are not to be construed as investment advice
