By Dr. Renisha Chainani, Head- Research, Augmont – Gold for all
The FOMC meeting minutes from November 1st were the significant development this week, providing additional insight into the Fed’s outlook for the next months. Markets were not particularly excited by the Fed minutes, partly because of the recent wave of encouraging US data. Even though the markets have already determined that interest rates have peaked and will be slashed in the upcoming year, Chair Powell is still reluctant to declare that the Fed has triumphed over inflation. Chair Powell maintains that the US central bank will raise rates further if necessary, but the market predicts a 100 basis point drop in US interest rates by the end of next year, with the first 25 basis point reduction scheduled in May 2024.
The US dollar has been declining as the market is now supporting the idea that interest rates won’t rise further. Since the start of November, the US dollar index has dropped four points and easily broken through multiple levels of support. More losses are probably in store if the DXY fails to regain the 200-day simple moving average of 103.6.
Since November 10, when the price of gold bounced off the significant 200-day SMA, the metal has been on a sharp rise. The latest rally seems to be reviving after the weekly closing above $2000 (Rs 61000). The rally is gaining steam again with the next target for Gold being a previous high of $2018 (~Rs 62000) and then $2045 (~ Rs 62800). On the downside, support is $1987 (Rs 60800).
Since the Silver price closed over $24, it is finally gathering traction. The industrial demand for silver is predicted to increase by 8% this year to a record 632 million ounces, indicating that the fundamentals are sound. Investment in photovoltaics, the electricity grid, 5G networks, consumer electronics expansion, and increasing electric vehicle output are some of the main factors influencing this performance.
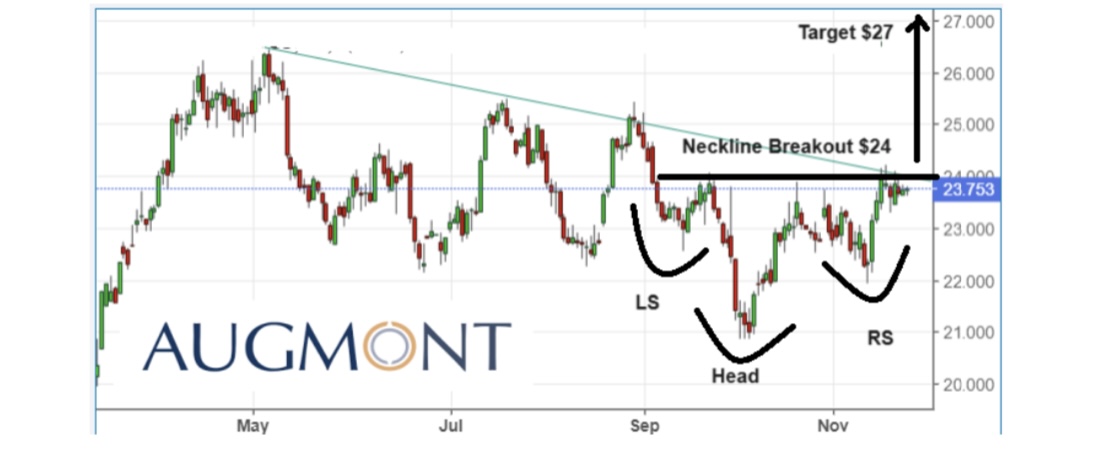
International Silver Daily Chart

From a technical perspective, Silver prices have been consolidating in the range of $21 and $24 for the last three months and prices have finally closed above $24 (~Rs 73500) this week. This coincides with the down-trendline breakout and also the Neckline breakout level at $24 of the Inverse Head and Shoulder pattern formed on daily charts. The target for this Inv H&S pattern would be $27 (~ Rs 82000), which means a 12% upside is forecasted in Silver from current levels in next few weeks. On the downside, support is $23 (~Rs 71500).
Disclaimer: This report contains the opinion of the author, which is not to be construed as investment advice. The author, Directors, and other employees of Augmont Enterprise Private Ltd. and its affiliates cannot be held responsible for the accuracy of the information presented herein or for the results of the positions taken based on the opinions expressed above. The above-mentioned opinions are based on information, which is believed to be accurate, and no assurance can be given for the accuracy of the information. The author, directors other employees and any affiliates of Augmont Enterprise Private Ltd cannot be held responsible for any losses in trading. In no event should the content of this research report be construed as an express or implied promise, guarantee or implication by or from Augmont Enterprise Private Ltd. that the reader or client will profit or the losses can or will be limited in any manner whatsoever. Past results are no indications of future performance. Information provided in this report is intended solely for informative purposes and is obtained from sources believed to be reliable. The information contained in this report is in no way guaranteed. No guarantee of any kind is implied or possible where projections of future conditions are attempted. We do not offer any sort of portfolio advisory, portfolio management or investment advisory services. The reports are only for information purposes and are not to be construed as investment advice
