
By Dr. Renisha Chainani, Head- Research, Augmont – Gold for all
The latest US Jobs Report showed 272k new jobs created in May, dwarfing expectations of 185K and April’s 165k. Precious metals were trading strong throughout the week but came into pressure after the NFP numbers hit the screens.
Gold slumped more than $100 and Silver tumbled 7%, falling the most in almost three years as surprise strength in a key US jobs report dashed hopes that the Federal Reserve will be able to start lowering interest rates soon.
Due to information indicating that China’s central bank did not purchase any gold last month—a significant buying binge that lasted for eighteen months and contributed to the precious metal’s rise—gold was already trading down on Friday. Since November 2022, as global tensions have increased, the People’s Bank of China has been building up its reserves and spearheading a rush of acquisitions by central banks throughout the globe.
Gold
In 2024, gold prices have skyrocketed. The metal continues to defy conventional market linkages with the US dollar and equities markets, having reached all-time nominal price highs in May. The Fed’s restrictive monetary policy is the reason why the dollar is stronger. Since gold is valued in dollars, the dollar and the shining metal typically move against each other when everything else is equal.
Furthermore, owning gold has an opportunity cost since, unlike fixed income, the yellow metal pays no coupon. This year, the yield on the US 10-year Treasury note has remained at 4.5%. A great deal of danger and uncertainty surrounds the second half of 2024 because of the impending US presidential elections. Another factor that might depress prices is the US budget deficit.
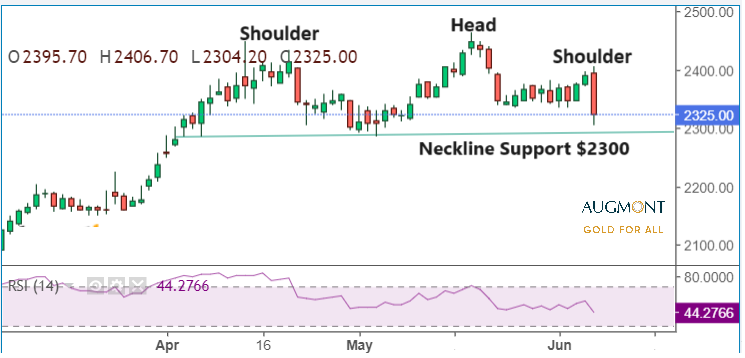
From a technical perspective, Gold has formed a Head and Shoulder pattern on Daily charts in the last two months with a record high touched above $2450. Neckline support of this H&S formation is $2300. If prices break this level and sustain below it, the next target could be $2150.
Gold prices could consolidate around $2300-2350 next week before making the next big move. Any escalation in geopolitical tensions can support the prices and if prices sustain above $2400 right shoulder, this view will be negated.
International Gold Weekly Chart
Silver
Since February, silver has been gradually outperforming gold. Last month, silver prices shot up to an 11-year high. The Silver Institute’s analysis indicates that, even before accounting for inventory transfers into and out of silver exchange-traded funds, there was a cumulative shortage of almost 663 million ounces of silver required to fulfil demand between 2021 and 2023. This deficiency represents about 80% of the world’s yearly production of silver mined. In 2024, another 215-million-ounce deficit is anticipated. There is pressure for greater silver prices alone on this premise.
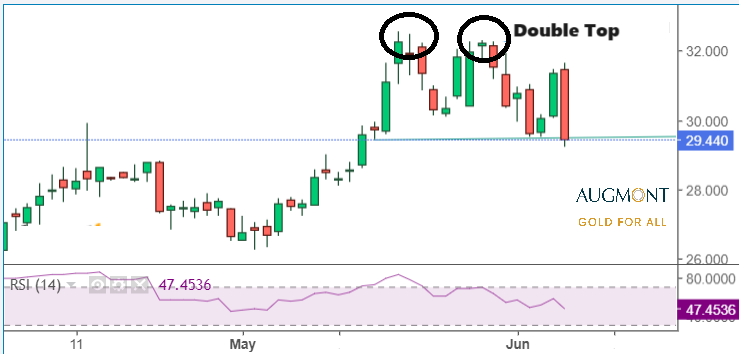
On the other hand, silver prices dropped below $30 this week as the US imposed 50% tariffs on Chinese solar cell imports to halt demand. From the technical perspective, Silver has formed Double Top formation around $32.5 on daily charts time frame. As prices have closed below the important support of $29.5, the Double top formation target is $28.50 and $26.50.
International Silver Weekly Chart
Disclaimer: This report contains the author’s opinion, which is not to be construed as investment advice. The author, Directors, and other employees of Augmont Enterprise Private Ltd. and its affiliates cannot be held responsible for the accuracy of the information presented herein or for the results of the positions taken based on the opinions expressed above. The opinions mentioned above are based on information, which is believed to be accurate, and no assurance can be given for the accuracy of the information. The author, directors other employees and any affiliates of Augmont Enterprise Private Ltd cannot be held responsible for any losses in trading. In no event should the content of this research report be construed as an express or implied promise, guarantee or implication by or from Augmont Enterprise Private Ltd. that the reader or client will profit or the losses can or will be limited in any manner whatsoever. Past results are no indications of future performance. Information provided in this report is intended solely for informative purposes and is obtained from sources believed to be reliable. The information contained in this report is in no way guaranteed. No guarantee of any kind is implied or possible where projections of future conditions are attempted. We do not offer any sort of portfolio advisory, portfolio management or investment advisory services. The reports are only for information purposes and are not to be construed as investment advice.