
By Dr. Renisha Chainani, Head- Research, Augmont – Gold for all
Gold saw a steep weekly loss of more than 4% last week, its most since November 2024, as it dropped toward $3180. Since its April peak of $3500, the precious metal has lost more than $300 as technical selling quickens and safe-haven demand wanes.
After the US and China agreed to lower tariffs for 90 days last week, risk sentiment improved. Meanwhile, geopolitical tensions stayed low as India-Pakistan and Middle East threats stabilised. The first direct meetings between Ukrainian and Russian officials since 2022 were eventually held after a period of contradictory reports and diplomatic impasse.
Furthermore, following Friday’s market close, the Moody’s Ratings agency lowered the US’s sovereign debt credit rating. Citing unsustainable debt growth and growing interest rates, the agency downgraded U.S. debt from Aaa to Aa1. It changed its assessment of the United States from “negative” to “stable” at the same time. The US is dealing with growing debt finance costs that are significantly higher than those of comparable government debt loads, according to Moody’s. In particular, US interest obligations “that are significantly higher than similarly rated sovereigns” were emphasised by Moody’s.
Weaker-than-expected U.S. economic data has strengthened market expectations of interest rate cuts by the Federal Reserve, pushing the dollar lower and reducing Treasury yields—factors that typically support non-yielding assets like gold. Caught between these opposing forces, gold prices may continue to face headwinds. However, significant losses below current levels appear unlikely, as despite recent optimism surrounding trade and geopolitics, uncertainty remains the dominant theme for market participants.
The market may take a wait-and-see stance due to changing investor attitudes in the global marketplace, which might cause gold prices to drop this week. This week’s selloff is the largest since mid-June 2021 and is marginally steeper than the November selloff following President Donald Trump’s election victory.
At this point, gold is rapidly losing money and appears to be about to experience another decline. Fears of a trade war, easing geopolitical tensions, and the Fed’s propensity to maintain its current monetary policy are all factors that are hurting the price of gold.
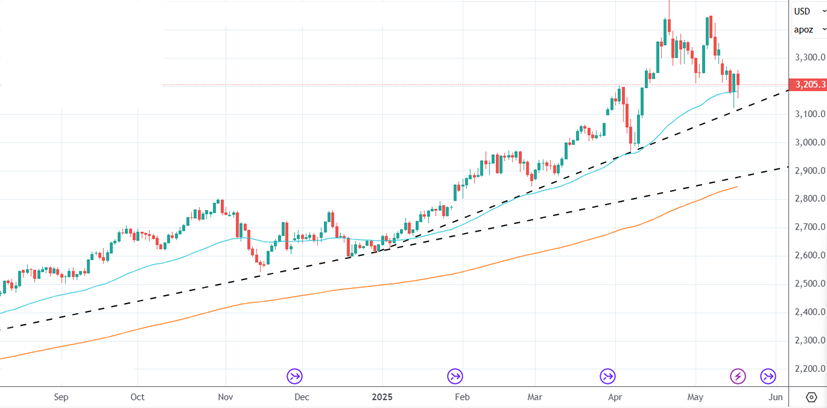
The yellow metal is still under pressure going into the weekend, according to technical analysis, trading close to $3180 after failing to hold above the key $3200 barrier. A possible trend reversal from April’s record highs is indicated by the bearish double top pattern visible on the daily chart. The 50-day Exponential Moving Average (EMA) around $3170 further supports the $3160–$3150 (~Rs 91500) support zone, which is in tight alignment with the pattern’s neckline. A clear breach below this range would pave the way for a more significant decline in the direction of the $3000 (~Rs 86000) handle.
Gold Jun Futures Daily Chart
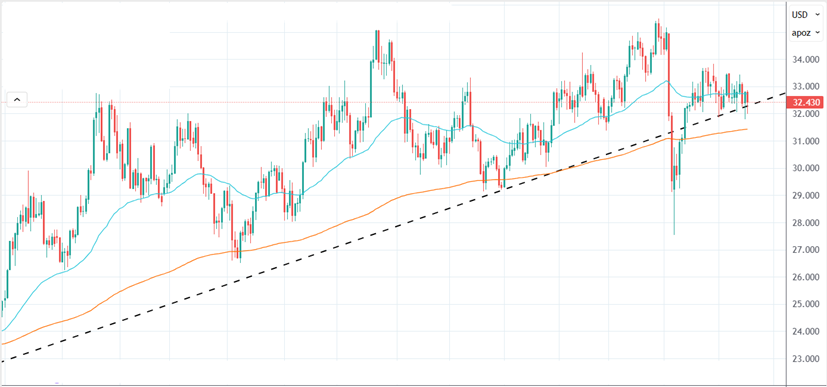
Support for silver was maintained over $32 an ounce last week. Silver was down 1.5% at $32.26, and the ratio of gold to silver has fallen back below 100 due to silver’s greater outperformance over gold. The rotation into silver should continue as investors shift their attention to improved industrial activity and recession fears begin to subside. Silver is expected to continue its range-bound momentum from $32 (~Rs 94000) to $34(~Rs 98000) going forward.
Silver July Futures Daily Chart
Disclaimer: This report contains the author’s opinion, which is not to be construed as investment advice. The author, Directors, and other employees of Augmont Enterprise Private Ltd. and its affiliates cannot be held responsible for the accuracy of the information presented herein or for the results of the positions taken based on the opinions expressed above. The opinions mentioned above are based on information, which is believed to be accurate, and no assurance can be given for the accuracy of the information. The author, directors other employees and any affiliates of Augmont Enterprise Private Ltd cannot be held responsible for any losses in trading. In no event should the content of this research report be construed as an express or implied promise, guarantee or implication by or from Augmont Enterprise Private Ltd. that the reader or client will profit or the losses can or will be limited in any manner whatsoever. Past results are no indications of future performance. Information provided in this report is intended solely for informative purposes and is obtained from sources believed to be reliable. The information contained in this report is in no way guaranteed. No guarantee of any kind is implied or possible where projections of future conditions are attempted. We do not offer any sort of portfolio advisory, portfolio management or investment advisory services. The reports are only for information purposes and are not to be construed as investment advice.