By Dr. Renisha Chainani, Head- Research, Augmont – Gold for all
Gold gained 3% in the first half of the week to a record high of $2488 (Rs 74730) and then fell by 4% in the second half to close around $2400 (Rs 73000), creating a bearish “Inverted Hammer” candlestick pattern on weekly charts. Silver fell by more than 5.5% during the week as US political uncertainty boosted the US Dollar appeal.
As the US CPI came to 3% last week, more than two rate cut expectations started to rise At the start of the week. According to Fed Fund Futures, the market anticipates the first rate drop in September, practically another in November, and a total of almost three rate cuts by the end of the year. This now appears to be an extremely ambitious undertaking.
Trader’s sentiment fluctuates owing to a variety of causes. The Chinese economy is expanding slower than projected, and there is rising speculation that former President Donald Trump may win the November 5 elections. Aside from that, speculations arose that US President Joe Biden may withdraw from the campaign as high-level democrats stated surveys following Trump’s assassination attack reveal that he can’t beat him.
Following an assassination attempt on Donald Trump, anticipation for his comeback as president of the United States soared. Meanwhile, mounting speculation that US President Joe Biden could quit his re-election attempt due to medical issues has boosted Trump’s chances of winning the presidential race. Trump is renowned for favouring protectionist trade policies, which strengthens the US Dollar’s attractiveness.
Gold Weekly chart
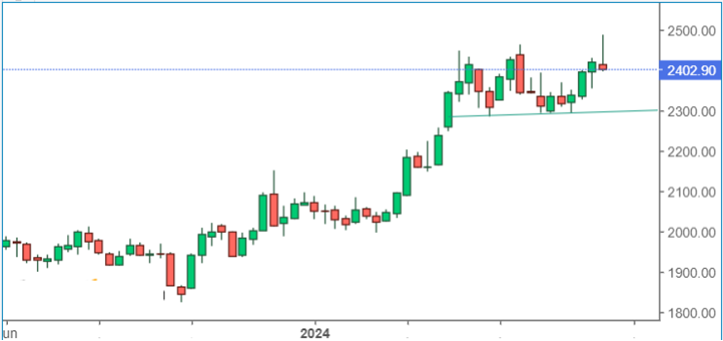
From a technical standpoint, it seems, that Gold gave a false breakout above $2450 (Rs 74000) and has reversed. A bearish “Inverted Hammer” candlestick pattern has been formed on weekly charts. It seems we have seen short-term top for the prices and prices might retrace back in the old range of $2300 (Rs 71000) and $2400 Rs (Rs 73000) next week. On the other side, gold needs to sustain above $2450 to start its new bull run.
Silver Weekly chart
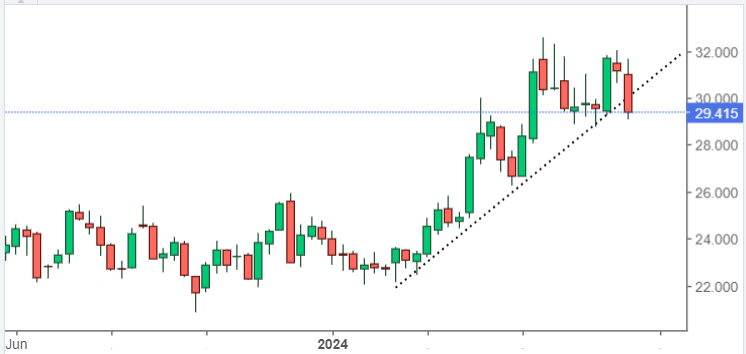
Silver has broken uptrend line support of $30 on weekly charts, the next very important support is $29. Prices should rebound from here for the bull run to continue further. If $29 (Rs 90000) is taken away, we can see prices falling towards $26.5 (Rs 86500). If we see a reversal next week, Silver needs to sustain above $30 (Rs 90500) to head higher towards $32 (Rs 94000).
Disclaimer: This report contains the author’s opinion, which is not to be construed as investment advice. The author, Directors, and other employees of Augmont Enterprise Private Ltd. and its affiliates cannot be held responsible for the accuracy of the information presented herein or for the results of the positions taken based on the opinions expressed above. The opinions mentioned above are based on information, which is believed to be accurate, and no assurance can be given for the accuracy of the information. The author, directors other employees and any affiliates of Augmont Enterprise Private Ltd cannot be held responsible for any losses in trading. In no event should the content of this research report be construed as an express or implied promise, guarantee or implication by or from Augmont Enterprise Private Ltd. that the reader or client will profit or the losses can or will be limited in any manner whatsoever. Past results are no indications of future performance. Information provided in this report is intended solely for informative purposes and is obtained from sources believed to be reliable. The information contained in this report is in no way guaranteed. No guarantee of any kind is implied or possible where projections of future conditions are attempted. We do not offer any sort of portfolio advisory, portfolio management or investment advisory services. The reports are only for information purposes and are not to be construed as investment advice.