
By Dr. Renisha Chainani, Head- Research, Augmont – Gold for all
Gold prices plummeted more than 3% last week, while the dollar remained at two-week highs after US inflation data met expectations, implying the Federal Reserve may be hesitant about further rate reduction. Gold prices underwent a week of unprecedented volatility, establishing a new all-time high before falling sharply. The precious metal’s eight-week winning streak came to an abrupt stop as the dollar strengthened and the mood shifted toward impending tariffs.
Dollar Rebounds
The dollar index rose 0.94% last week to 107.66, putting pressure on gold prices. President Donald Trump’s threats to levy tariffs on Canadian and Mexican goods beginning next week have had a significant impact on market mood. Investors were concerned about potential inflationary effects from increased tariffs, which fuelled gold’s first rally.
Inflation and GDP Data in line with expectation
PCE prices climbed 0.3% month on month in January, meeting expectations, while the annual rate fell to 2.5% from 2.6% in December. The survey also revealed a surprise 0.2% reduction in consumer expenditure, the first in nearly two years, although income rose 0.9%, the most in a year. According to the second reading of the US GDP issued by the US Bureau of Economic Analysis, the economy expanded by 2.3% yearly in the fourth quarter of 2024, as previously expected. Markets now expect only two Fed rate cuts this year, as inflation continues above the 2% target and officials monitor changes in US trade policy.
Donald Trump’s proposed tariffs uncertainty remains.
President Donald Trump said that his proposed 25% tariffs on Mexican and Canadian goods will go into effect on March 4, coupled with an additional 10% charge on Chinese imports. He also threatened to levy 25% on EU goods. If Trump achieves an agreement with Canada and Mexico to postpone tariffs, the immediate market reaction could cause a USD selloff and help Gold recover. Similarly, gold is expected to gain traction if Trump reconsiders raising duties on Chinese imports.
ETF and CFTC Holdings rising
Beyond short-term speculative swings, investor demand for gold is increasing. Last week, the WGC reported that 48 tons of gold worth $4.6 billion flowed into North America-listed gold-backed ETFs, the highest one-week increase since early April 2020. Since the start of the year, speculative bullish bets on gold futures have increased dramatically. The CFTC’s disaggregated Commitments of Traders data show that gold’s net long peaked at more than 200,000 contracts at the end of January, the largest level in over three years. Since then, momentum traders have slowly liquidated their long holdings, with selling pressure nearing critical levels.
The week starts with uncertainty.
Friday’s dispute between Ukraine President Volodymyr Zelenskiy and US President Donald Trump, as well as Europe’s growing disagreements with the US over its Russia policy, will support safe-haven gold, as investors keep an eye on European efforts to develop a Ukrainian peace plan. The United States’ economy is deteriorating significantly, and growth is expected to decline this quarter. This could push the Federal Reserve to relax its stance on rate cuts, benefiting gold.
Gold Apr Futures Daily Chart
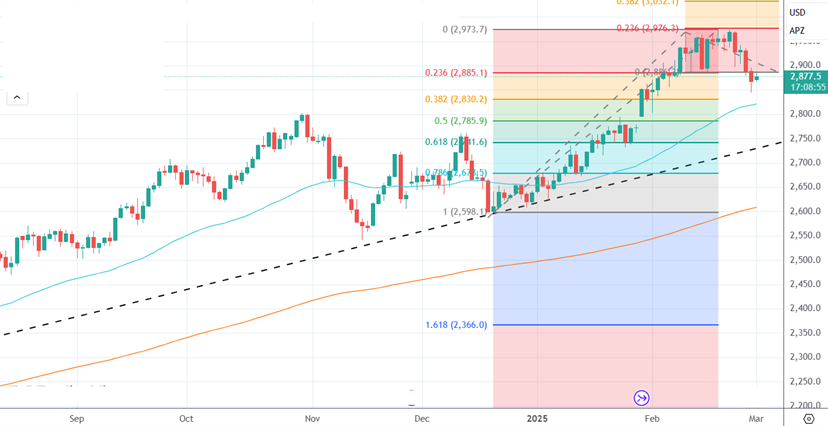
Gold Apr Futures are expected to recover this week on continued uncertainty with strong support at last week’s low of $2844(~Rs 84000) and 38.2% Fibonacci retracement of $2830 (~Rs 83500). On the upper side, prices need to sustain above 23.6% Fibonacci retracement of $2885 (~Rs 84900) to continue its uptrend to $2930(~Rs 85700) and higher.
Silver Daily Chart
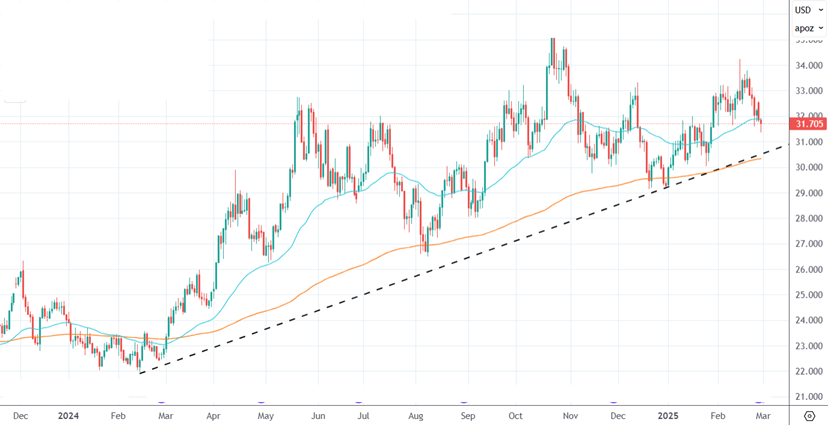
Silver has been trading in an uptrend for the last year, with prices taking support at the uptrend line. Now the support lies at $31 (~Rs 92000). On the upside, the resistance is $33 (~Rs 96000) and $34(~Rs 97500).
Disclaimer: This report contains the author’s opinion, which is not to be construed as investment advice. The author, Directors, and other employees of Augmont Enterprise Private Ltd. and its affiliates cannot be held responsible for the accuracy of the information presented herein or for the results of the positions taken based on the opinions expressed above. The opinions mentioned above are based on information, which is believed to be accurate, and no assurance can be given for the accuracy of the information. The author, directors other employees and any affiliates of Augmont Enterprise Private Ltd cannot be held responsible for any losses in trading. In no event should the content of this research report be construed as an express or implied promise, guarantee or implication by or from Augmont Enterprise Private Ltd. that the reader or client will profit or the losses can or will be limited in any manner whatsoever. Past results are no indications of future performance. Information provided in this report is intended solely for informative purposes and is obtained from sources believed to be reliable. The information contained in this report is in no way guaranteed. No guarantee of any kind is implied or possible where projections of future conditions are attempted. We do not offer any sort of portfolio advisory, portfolio management or investment advisory services. The reports are only for information purposes and are not to be construed as investment advice.