By Dr. Renisha Chainani, Head-Research, Augmont – Gold for All.
Gold started the year 2022 around $1800 (~Rs 48000) levels, climbed to $2076 (~Rs 55000) in March and fell to $1620 (~Rs 49000) in August. Prices have then recovered back to sub $1800 levels in December. So, all in all, it has wiped out all gains and losses of the year and is trading at the same level as January now on international markets. But in domestic markets, prices are close to Rs 54500 now, which is equal to around a 15% return. This is because of USDINR depreciating by the same percentage.
The Russia-Ukraine war was the main catalyst for the gold rally in Q1 2022. Rising real interest rates were a headwind for gold for Q2 and Q3. FED raised rates by 450 bps in 2022 to tame multi-decade high inflation. However, in Q4, we saw strong festive and marriage season demand, due to which prices picked up followed by FED’s hawkish stance.
After topping at 9.1% in June 2022, US CPI has cooled off gradually to 7.1% in November and its expected to retreat more in 2023. That will make FED stance more hawkish to keeping FED pivot from second quarter of 2023, which would lead to fall in Dollar Index and US Treasury yield and in turn, bullish for Gold.
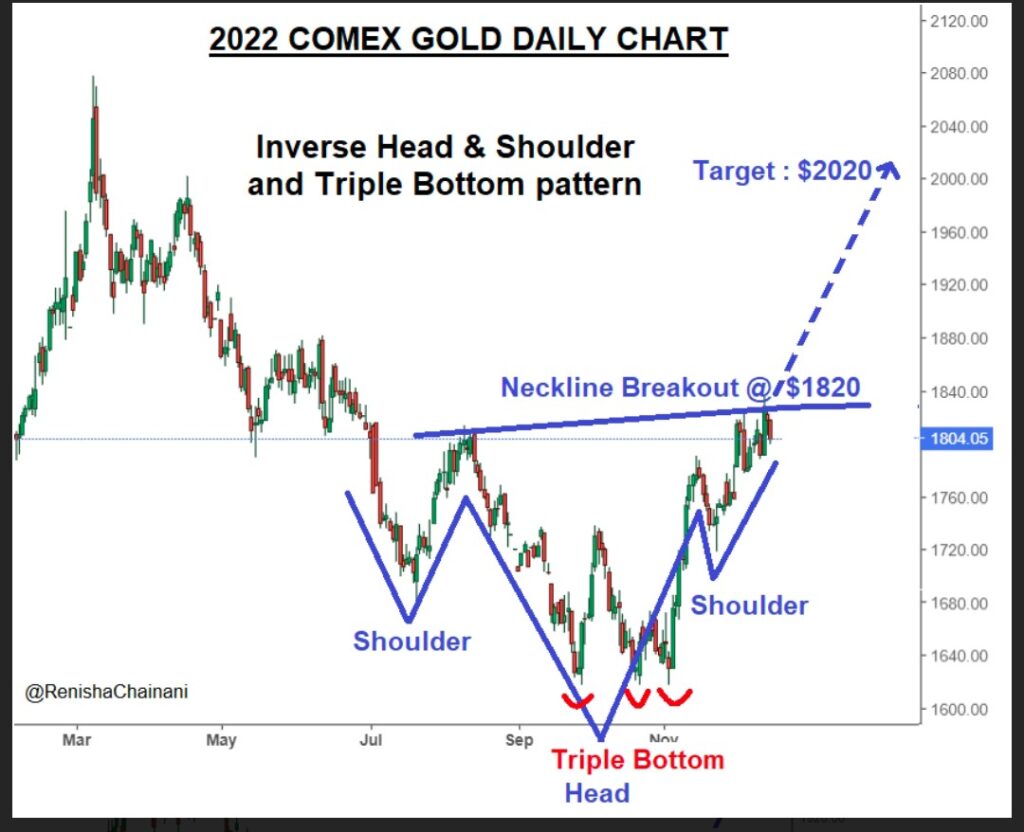
Moreover, we can see a Trend reversal in COMEX Gold Daily Chart as predicted by Inverse Head and Shoulder pattern and Triple Bottom pattern shown in chart below. The inverse head-and-shoulders pattern is a common downward trend reversal indicator. An inverse head and shoulders pattern forms when the price of an asset falls to a trough, then rises, falls for the second time, but this time the fall is steeper than the first. The price rises again and drops for the final time. Inverse head and shoulders pattern indicates the end of bearish phase and onset of an uptrend, when the price moves above the neckline resistance.
As we can see from the chart that gold prices have touched the low of $1620 (Head) thrice, which is also a Triple bottom pattern formation. A triple bottom is generally seen as three roughly equal lows bouncing off support followed by the price action breaching resistance.

Neckline resistance of Inverse H&S lies at $1820, if prices sustain above it, target would be $2000-2020. This means we can see 10% upside in gold prices. If USDINR remains constant above 80, domestic prices can touch the level of Rs 60000/gm in 2023.
16 Comments. Leave new
123456
Vy
Sirohi rajshtan
Sirohi rajshtan
Suresh Kumar
Bitturaj1630@gmail.com
I don’t think the title of your article matches the content lol. Just kidding, mainly because I had some doubts after reading the article. https://www.binance.com/de-CH/register?ref=UM6SMJM3
Thank you for your sharing. I am worried that I lack creative ideas. It is your article that makes me full of hope. Thank you. But, I have a question, can you help me? Create a free account
I don’t think the title of your article matches the content lol. Just kidding, mainly because I had some doubts after reading the article.
Can you be more specific about the content of your article? After reading it, I still have some doubts. Hope you can help me.
Can you be more specific about the content of your article? After reading it, I still have some doubts. Hope you can help me.
Thanks for sharing. I read many of your blog posts, cool, your blog is very good.
expansion slots
References:
topbookmarks.xyz
alternative to steroids
References:
travelersqa.com
References:
Aussie-online-stay casino jackpot games-guide
References:
Crown casino poker
References:
https://verde-casino-cashback.online-spielhallen.de/
References:
Best online casino bonuses
References:
https://graph.org/The-Star-Casino-Gold-Coast-Promotions-04-27