
A dot plot is a technique for displaying data on a chart with a horizontal and vertical axis in its most basic form. The number of data points in a data collection is graphically grouped by the value of each point in a dot plot. Similar to a histogram or probability distribution function, this provides a visual representation of the data distribution. Dot plots provide for a rapid visual inspection of the data to determine the data’s central tendency, dispersion, skewness, and modality.
The members of the Federal Open Market Committee of the United States Federal Reserve submit their forecasts for where interest rates should be, where inflation will be, and how much growth the economy will see in the future every quarter. The 18 members of the FOMC’s forecasts are then shown on a chart, with each member’s forecast represented by a dot. The consensus view is defined as a cluster of dots gathered around a single estimate, such as an interest rate.
Investors and analysts keep a close eye on the FED’s dot plot predictions for clues about interest rates’ future path. Each dot on the graph reflects a member’s opinion on where the federal funds rate should be at the end of each of the calendar years depicted, as well as in the “longer run” (the peak for the federal funds rate after the Fed has finished tightening or “normalizing” policy from its current levels).
FED Dot Plot on 17-Mar-2021
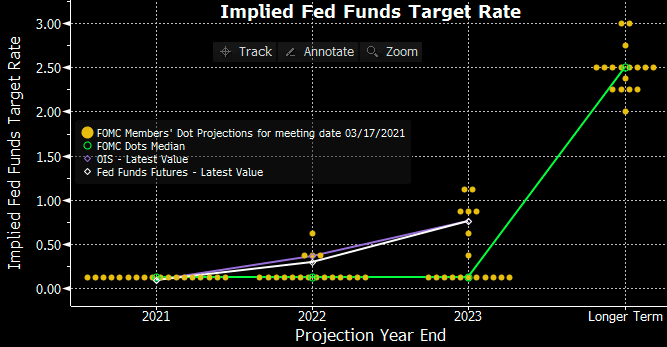
The FOMC’s latest “dot plot,” issued on Wednesday, revealed that the 18-member committee’s median forecast was for two interest rate rises in 2023. Because of stronger economic growth and inflation, more Federal Reserve policymakers are forecasting an interest-rate hike in 2023.
FED Dot Plot on 16-Jun-2021
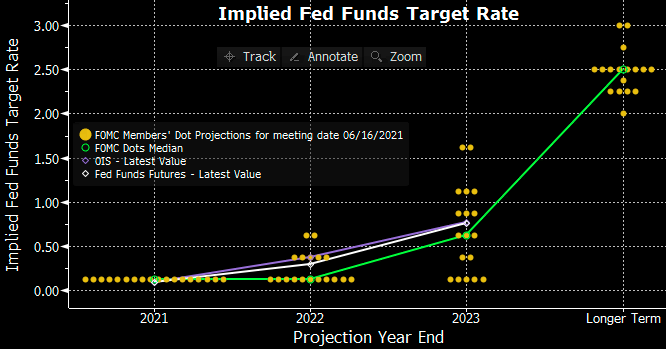
Higher or rising interest rates are always negative for bullion prices. As FED has indicated that it will raise interest rate twice in 2023, gold prices discounted this news and prices rattled down. Gold remains the most interest rate and dollar-sensitive commodity, and while the dollar reached a two-month high, it was the movements in Treasury yields that spooked the market. Looking ahead continued dollar strength will pose a challenge while gold should be able to withstand rising yields as long it is driven by rising inflation expectations.
Read more: QE Tapering and Impact on Gold